Cloud Monitoring in GCP is a comprehensive monitoring service that provides detailed insights into the health, performance, and availability of your applications and infrastructure. In this overview, we’ll cover the definition, how to use, commands (if applicable), use cases, examples, costs, pros, and cons of Cloud Monitoring in GCP.
Definition:
Cloud Monitoring is a powerful and scalable monitoring solution that collects metrics, logs, and traces from GCP services, third-party applications, and infrastructure. It allows you to create custom dashboards, set up alerts, and analyze the performance of your applications and infrastructure in real-time. Cloud Monitoring leverages the power of Stackdriver, Google’s monitoring platform, and offers seamless integration with GCP services.
How to use:
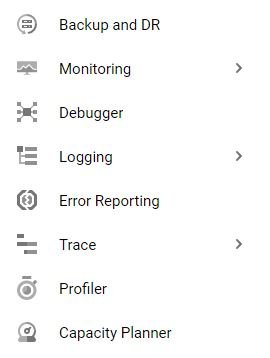
1. To get started with Cloud Monitoring, navigate to the Monitoring section in the GCP Console. If it’s your first time, enable the Monitoring API to start collecting data from your GCP services and resources.
2. Explore the pre-built dashboards for various GCP services, such as Compute Engine, App Engine, and Kubernetes Engine. Customize these dashboards or create new ones to visualize the metrics that matter most to your applications and infrastructure.
3. Set up alerting policies to receive notifications when specific conditions are met, such as high CPU usage, low memory, or increased latency. You can choose various notification channels, like email, SMS, Slack, or PagerDuty.
4. Use the Metrics Explorer to query and visualize custom metrics, and leverage advanced filtering and aggregation capabilities to gain deeper insights into your data.
5. Integrate Cloud Monitoring with Cloud Logging and Cloud Trace to analyze logs and traces alongside metrics for a complete observability solution.
Commands:
While most of the interaction with Cloud Monitoring is done through the web-based GCP Console, you can also use the `gcloud` command-line tool and the Monitoring API to manage resources, metrics, and alerting policies. For example:
– To list the available metric descriptors: `gcloud monitoring metric-descriptors list`
– To create an alerting policy: `gcloud monitoring policies create POLICY_NAME –condition CONDITION`
Use cases:
1. Monitoring the health, performance, and availability of GCP services and resources.
2. Detecting and diagnosing issues in applications and infrastructure.
3. Proactively identifying performance bottlenecks and optimizing resource usage.
4. Ensuring compliance with service level agreements (SLAs) and maintaining high-quality user experiences.
Examples:
1. A DevOps engineer using Cloud Monitoring to monitor the health of a Kubernetes Engine cluster, setting up alerts for high CPU and memory usage, and optimizing resource allocation based on historical trends.
2. A developer using Cloud Monitoring to identify and diagnose performance issues in a Compute Engine instance running a web application, analyzing metrics, logs, and traces to pinpoint the root cause.
Costs:
Cloud Monitoring pricing is based on the number of monitored resources, metrics, and alerting policies. It offers a free tier that includes a certain amount of monitoring data and alerting policies. Beyond the free tier, you’ll be charged based on your usage. Detailed pricing information can be found on the Cloud Monitoring pricing page.
Pros:
1. Comprehensive monitoring solution that collects metrics, logs, and traces from GCP services, third-party applications, and infrastructure.
2. Customizable dashboards and powerful query capabilities for visualizing and analyzing data.
3. Flexible alerting policies and integration with various notification channels.
4. Seamless integration with GCP services and other Stackdriver components, such as Cloud Logging and Cloud Trace.
Cons:
1. Costs can add up quickly, especially for large-scale deployments with numerous resources, metrics, and alerting policies.
2. The learning curve for new users might be steep, particularly for those not familiar with monitoring concepts and Stack driver’s terminology.
3. While Cloud Monitoring offers a wide range of metrics, it might not cover all specific metrics required for certain use cases, requiring the use of custom metrics, which can add to the complexity and costs.
4. Users familiar with alternative monitoring solutions, like Prometheus, Grafana, or Datadog, may face a learning curve when adapting to Cloud Monitoring and its features.
In summary, Google Cloud Monitoring is a robust and feature-rich monitoring solution that provides detailed insights into the health, performance, and availability of your applications and infrastructure. Its seamless integration with GCP services and other Stackdriver components makes it an ideal choice for developers and operators working within the GCP ecosystem. However, it’s essential to consider the costs and potential learning curve associated with using Cloud Monitoring, especially for large-scale deployments or users with experience in alternative monitoring solutions. Careful planning and optimization of monitored resources, metrics, and alerting policies can help minimize costs while maximizing the benefits of Cloud Monitoring.
