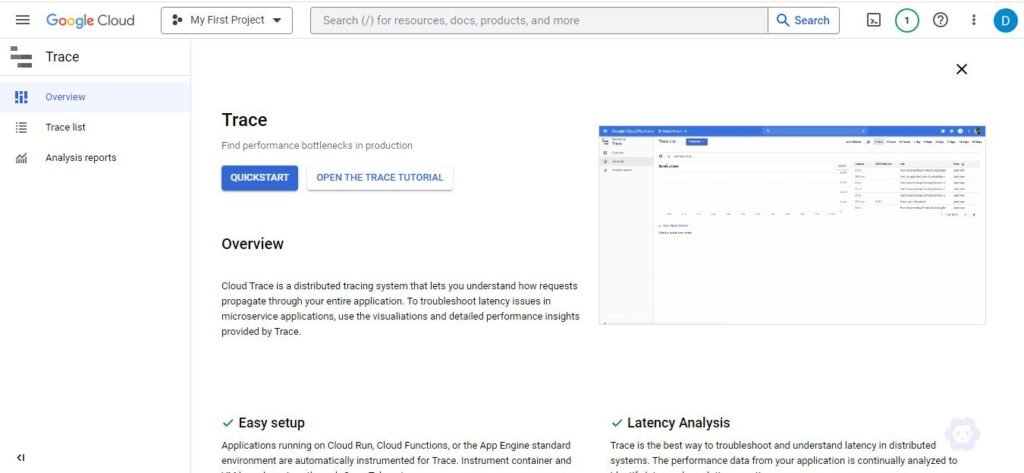
Cloud Trace in GCP is a distributed tracing system that collects and analyzes latency data from applications to identify performance bottlenecks and optimize user experience. In this overview, we’ll cover the definition, how to use, commands (if applicable), use cases, examples, costs, pros, and cons of Cloud Trace in GCP.
Definition:
Google Cloud Trace is a tool for monitoring, analyzing, and visualizing latency data from your applications and services. It captures and aggregates traces from various sources, including GCP services, third-party applications, and custom instrumentation. Cloud Trace allows you to analyze traces, view detailed trace data, and compare latency distributions over time.
How to use:
1. To get started with Cloud Trace, ensure that your application or service is instrumented to generate traces. Many GCP services, such as App Engine and Cloud Functions, automatically generate traces. For custom applications or third-party services, you’ll need to integrate with the Cloud Trace API or use OpenTelemetry libraries.
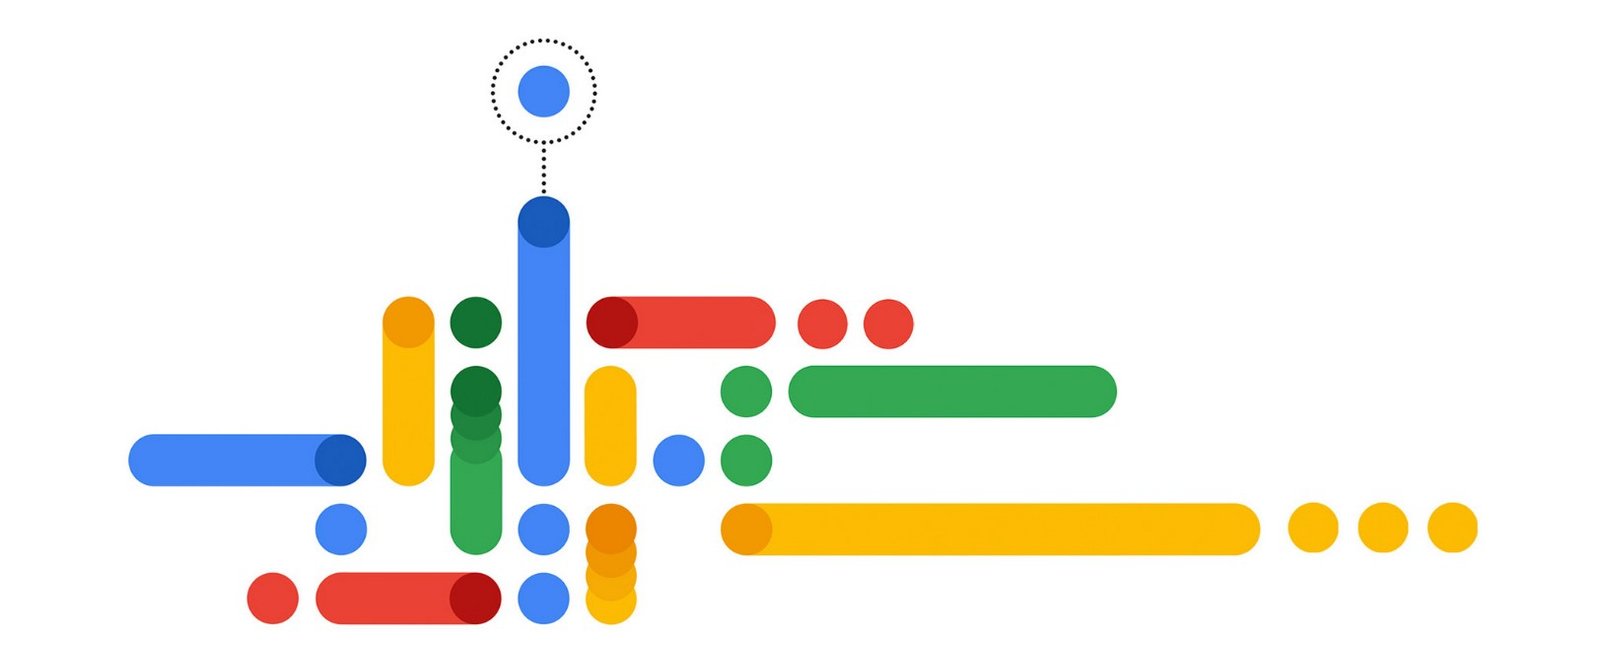
2. Navigate to the Trace section in the GCP Console to view and analyze trace data. You can use the Trace list to explore individual traces and the Trace Waterfall view to visualize the flow of requests and dependencies between services.
3. Use the Trace Analysis Reports to compare latency distributions over time, helping you identify trends and performance improvements or regressions.
Commands:
While most interactions with Cloud Trace are done through the web-based GCP Console, you can also use the `gcloud` command-line tool and the Trace API to manage trace data. For example:
– To list trace data for a specific time range: `gcloud trace traces list –start-time=”2021-01-01T00:00:00Z” –end-time=”2021-01-31T23:59:59Z”`
– To read detailed information about a specific trace: `gcloud trace traces describe TRACE_ID`
Use cases:
1. Analyzing application performance and identifying bottlenecks.
2. Visualizing the flow of requests and dependencies between services in a microservices architecture.
3. Monitoring and optimizing user experience by identifying slow or failing requests.
4. Comparing latency distributions over time to track performance improvements or regressions.
Examples:
1. A developer using Cloud Trace to analyze the performance of a web application running on App Engine, identifying slow database queries and optimizing them to reduce latency.
2. An SRE using Cloud Trace to monitor a microservices-based system, visualizing dependencies between services, and diagnosing issues in the request flow.
Costs:
Cloud Trace offers a free tier that includes a certain number of trace spans per month. Beyond the free tier, you’ll be charged based on the number of trace spans ingested, the amount of trace data storage, and the number of Analysis Reports generated. Detailed pricing information can be found on the Cloud Trace pricing page.
